MonitorPro in cPFence lets you keep track of website uptime and server health in real-time. Whether you want a full cluster status overview or need to check uptime on demand, cPFence makes monitoring easy using both the WebUI and CLI.
Method 1: View Uptime from the Dashboard
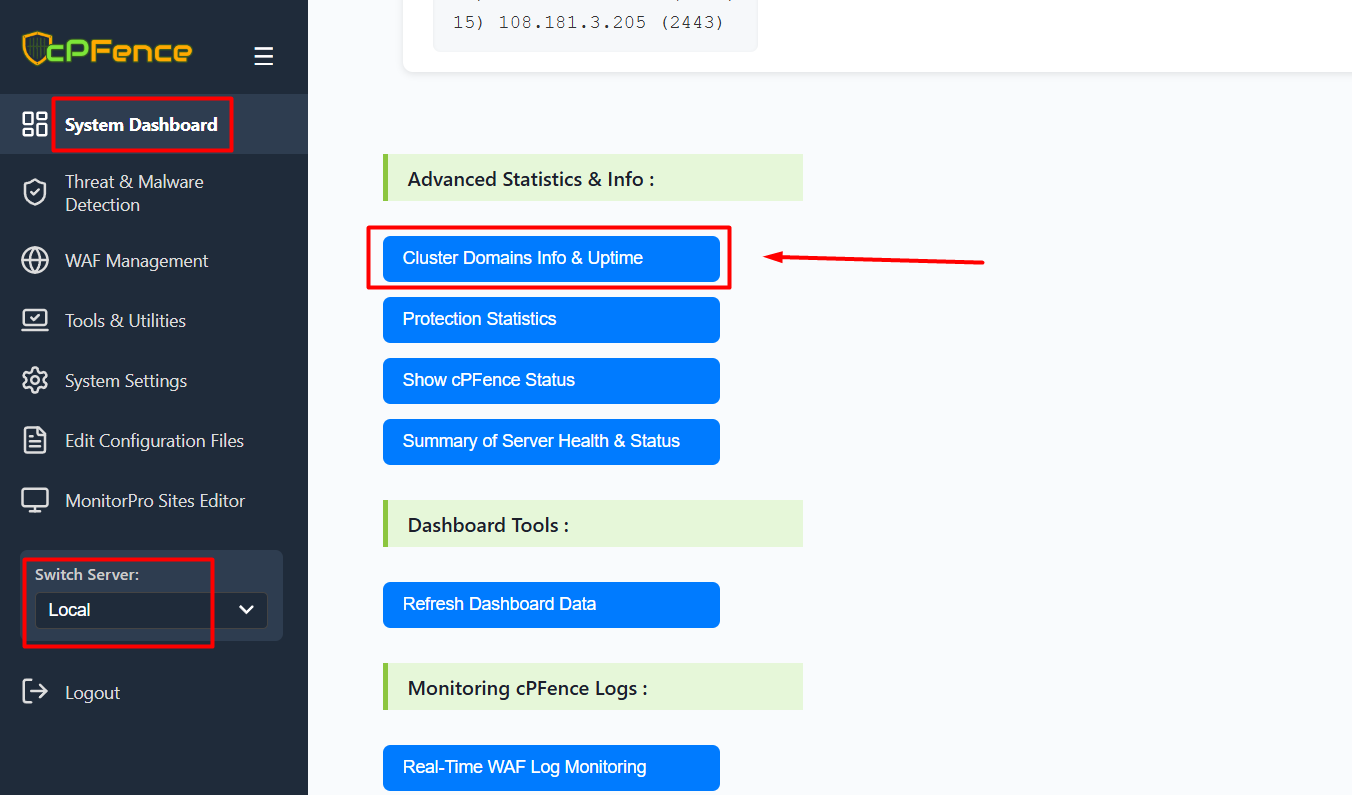

- Open the cPFence WebUI on your Main Control Panel server.
- Go to System Dashboard in the left sidebar.
- Under Advanced Statistics & Info, click Cluster Domains Info & Uptime.
- You’ll see a searchable table showing each domain, its server, user, status (Up/Down), and how long a site has been down if not up.
Method 2: Run an Uptime Check On Demand

- Open the cPFence WebUI on your Main Control Panel server.
- Go to Tools & Utilities in the sidebar.
- Under cPFence MonitorPro – Website Monitoring, click Run Uptime Check.
- This will perform a real-time scan and display the current status for all domains in your cluster.
Method 3: Check Uptime from the CLI
You can also check website uptime from the command line:
cpfence --monitorpro-scan-statusThis command quickly reports the uptime status of all websites in your cluster, ideal for advanced users or when working via SSH.
Need Further Assistance?
If you encounter any issues or need additional help, feel free to reach out to our support team via your client portal.
